Saturday, August 10, 2019

Three main types of assets to manage: Part 2 of 3

Three main types of assets to manage: Part 2 of 3

The second of three asset types you need to manage are liquid assets that are part of your personal balance sheet. As mentioned in the first part of this series, the main point of the series is that each asset has a net present value, and that the balance between them shifts throughout life as you use one type of asset to gain another. Long term success depends on an understanding of the three asset types and how to balance them.

What are liquid assets anyway?

Liquid asset are those asset that you can easily convert from one form to another. Cash, stocks with high trading volumes, exchange traded funds, and bonds etc. As a rule of thumb, if it takes less than a day or two to convert the asset from one type to another, it is a liquid asset.

I will not go in depth into each type of liquid asset, but in sum:

  • Stocks are very volatile and their price more often reflects underlying market sentiment than their "real" value (by that I mean their ability to generate and return capital to shareholders over the company's lifetime).
  • Bonds are risky in low interest rate environments and are generally not a good protection against inflation. Besides, your salary is your fixed income. Only buy bonds if you are in need of a mental cushioning.
  • Cash is shit. Absolutely useless to hold. Get it working for you as soon as possible (either through rent generation or experience generation (aka having fun)).

How should you invest in liquid assets?

I am a big fan of ETFs and low cost funds for one simple reason: to generate an alpha has an alternative cost. It costs both time and money to do research on stocks and trying to find market beating performers. Let us ignore the fact that most professional investors fail to beat the market over time and that most average investors fail to generate a positive alpha. 


Back to the alternative cost ... say that you start with a portfolio of KSEK 100 (which is the median net worth of a 35 year old Avanza customer). Assume that you generate a Peter Lynch level alpha of 15% (compared with SP500 dividends reinvested), which you won't. Let us compare this with boosting your annual income with KSEK 50 and 100 respectively (numbers are inflation adjusted).


Using the 1977-1990 numbers, it would have taken you 13 years of Lynch performance (i.e., his entire investment career at Fidelity) to beat a strategy where you simply worked for KSEK 50 more annually and invested that money into a simple index fund. I would argue that it is a lot easier to earn KSEK 50 more annually than it is to be Peter Lynch. 

Another way to phrase the above, is to say that you would need a portfolio size of KSEK 423 before you should consider attempting Peter Lynch level returns (at that level you are growing your portfolio with KSEK 97) over simply trying to earn an extra KSEK 50 over the SP500 return. At KSEK 100 extra annually, you should not attempt to be Peter Lynch until you have at least KSEK 1'187 in your investment portfolio. And if we consider that the median 50 year old Swede at Avanza had KSEK 173 in their stock accounts, you are not very likely to ever have stock holdings at a size that would justify you attempting to become one of the greatest market investors of all time.

The idea to work extra and move that income into stocks is effectively equivalent with you transferring your human capital into liquid assets.

Next time, I will explain what the third asset type is and why I prefer to invest in it.

Friday, July 26, 2019

Månadsrapport juli och utveckling sedan start

Sedan start

Vi börjar med en tillbakablick.

Start: 2017-03-27
AvanzaKF: +28.82%
NordnetKF: +51%
NordnetISK: +38.07%

Jag är nöjd givet bolagen jag har valt att investera i (bolag med riktigt tråkiga produkter).

Juni månads utdelningar

CNI  23
BPY 1049
BEP 744
BIP 436
O    85
VGWL 6
VFEM 469
SPHD 143
HEMF 180
SUM 3135

Affärer

SCA   175
SGINV 22
SELV 20
Kind -138
JNJ   4
Entra 65
Elkem 35
Bets  470
BNS 6
AOS   9
NDA -470
VZLD  20
SHB 50

Som planerat köptes en del norska innehav in. Följer upp och ökar allt eftersom. Den stora affären vad BETS och skiftet från KIND till BETS precis innan KIND tappade 20+%. BETS är en risk, men den får bli kryddan. God utdelning som väl täcks av kassaflödet och den starkaste spelaren i en krisande bransch. Givet blankningen lägger jag ingen stop loss på den. Ett säljbeslut får motiveras av ändrade fundamenta.

Nordea såldes ut efter en usel rapport. Byte till SHB. Avvaktar en del i bank nu och inväntar lägre priser.

Köpte även in realtillgångar via SCA, Entra och VZLD.

Givet inköpen sänks årsutdelningen med 912 SEK främst via försäljningen av Nordea. Får kompensera för detta på annat håll :).

Plan

Ingen direkt. Kanadensiska banker börjar bli intressanta igen. Fast bank är en krisande industri nu och värre kommer det bli ifall långa räntan fortsätter ner. Banker + realtillgångar kan fungera bra. Norge fortfarande aktuellt.


Monday, July 8, 2019

Rent generation throughout economic cycles

Key takeaway 

When the stock market seems expensive and valuations are "crazy", your ability to earn an income is increased and you have more to spend on buying rent generating assets. When the stock market is cheap and valuations are attractive, your ability to earn money is reduced but the rent generating assets you buy are worth so much more.

On stock market valuations and income

Valuations are rather lofty today using most indicators. Normally, such an "overpriced" market leads people to question wether or not they should hold off any equity investments and put their capital somewhere safer (where ever that is).

The above is, in my view, a limited perspective. You should not blindly fixate on your stock portfolio's potential returns/decline but instead look at the possibilities that are available to you as a whole. Let us look at two scenarios:
  1. Market valuations are high, inflation is low, interest rates are abyssal and there are few options for rent generation outside of already highly valued stock markets, which continuously attract more and more risky capital from investors chasing a yield.
  2. Market valuations are low, rates are at zero and there is massive QE being started to prop up the economy. Wide spread pessimism and unemployment rates are sky high.
Both scenarios present both challenges and opportunities. Both have happened in the past. Both will happen in the future. So, how do we navigate these two scenarios? In Scenario 1 you should not expect stellar long term stock returns. In fact, with a Shiller PE of 30.5 and a 1-year PE of 22.25 we should expect a long term yield that is far below the average 7.35% that the SP500 has returned in the past. In fact, yields are at a record low of 4.49% and dividends are at 1.88% (note that it is important to take into account the risk free rate, today's numbers are not particularly bad compared to historical numbers, but the yield is nevertheless low). 

Does these low yields mean that we should expect lower total returns going forward? The simple answer is no. First of all, noone has any idea of what the future will bring. There is good reason to believe that several productivity enhancing technologies will be introduced within the next decade as companies are exploring the data economy and revolutions in energy technology are made on a seemingly yearly basis. But let's stay pessimistic and assume that the yield will stay that low. Here it is important to remember that equity returns is just one source of wealth accumulation. During a Scenario 1 period, it is far easier to supplement income, e.g., run a low risk business such as consulting. Capital is abundant and companies seem to have an endless smorgasbord of new technologies to invest in; the appetite for investments into potential future business areas is at an all time high. 

Let's run the math. I'd argue that it is rather trivial for any profession with a desired knowledge base (e.g., engineer/programmer) to boost their income through a side job or by starting their own company. I argue also that one can easily bill KEUR 10 annually in a Scenario 1 climate (for comparison, that is about 10 days work with going rates in major European cities). Now, the corporate taxes hover around 10-25% in the EU, so we will use a 20% rate. That leaves you with KEUR 8 to invest into stocks through your company. With an average yield of 7.35%, KEUR 8 is equivalent to having a portfolio worth KEUR 109. So, in a Scenario 1 economy, you can boost your income with the equivalent of having a portfolio of KEUR 109 in an average economy. 

Let us do another comparison so that we can see how powerful this effect is. Assume you have a portfolio of KEUR 500 in an average rate environment. That would grow your assets by EUR 36'750 annually. In today's environment, KEUR 500 only boosts assets by KEUR 22'450. The difference of EUR 14'300 corresponds to about two weeks of consulting work. And keep in mind that consulting work is easy to come by in a Scenario 1 environment! For the ambitious, a Scenario 1 environment represents an opportunity to really boost incomes and accelerate long term growth; an opportunity that especially favors those who are young and without a big portfolio to begin with (and lose during a crash).

The second scenario is a bit different. Consultancy work will be scarce. This is where a stable job matters. Elsewhere, I have argued that having a stable job during the latter parts of an economic expansion is one of the wisest investment decisions you can make. As stocks come crashing down, you buy yield at a very cheap price, setting yourself up for long term performance and asset growth.

Do not focus so blindly on the current rates and valuations, you cannot time the market and these fluctuations are out of your control anyway. Focus instead on what you can do given the current economic environment you are in. Are valuations sky high and there are few available alternatives on the market? Great! Focus on consulting and figure out how you can leverage your skills to boost your income. There is no way you can time the market or tell what the future brings. Done right, you will be the busiest during the economic boom when everything is joyful and filled with hope, and you can relax when everyone else is panicking anyway ...

Friday, June 28, 2019

Månadsrapport Juni

Maj månads utdelningar


HDIV 14028
JNJ 179
WM 66.63
O 85.86
SPHD 143.53
Totalt 14503.02


Affärer

Datacenter REITs ignorerar jag nu. Lägger de på bevakningslista och inväntar kris i branschen. Istället började jag min granskning av Norska aktier då jag har planer på att flytta till Norge på sikt om läget i Sverige försämras. Det blev även ett byte från LFs globalfond till Avanzas. Följande köp och byten gjordes:


S. Globalfond Investmentbolag 10
BETS 45
Elkem 25
Entra 5
Selvaag Bolig 10
AUSS 20
Avanza Global 754
LF Global Ind. (343)
AOS 9
KIND 8
SPG 1
HDIV 520
SHB 100
NDA 50

Med detta ökar årsutdelningarna med ungefär SEK 4400.

Plan nästa månad

Norge :).

Tuesday, June 25, 2019

Stock picking and screening of Norwegian stocks

Pick strong performers in sectors experiencing (cyclical) weakness

Today, I saw a piece of advice that keeps popping up from time to time: in sectors experiencing cyclical weakness, buy the firms who are the best performers in that sector. An interesting thought that reminds me of some observations I made during 2008; all the major banks crashed in Sweden but those not affected by the crisis quickly recovered. Here is a comparison between 070101 and 100101:


This makes a lot of sense and is fairly easy to incorporate into a strategy. Anyway, back to Norwegian stocks :). The thesis for Norway is simple: I wish to decrease my exposure to SEK + Norway is a country I can imagine moving to = Exposure to NOK through stocks is warranted.

Therefore, I will generate a list of stocks in Norway that are interesting to watch and do more research on. As always, I will focus on my investment criteria and only pick companies with a proven ability to churn out profits and dividends. I will also check if any sectors are experiencing weakness.

Norwegian dividend paying stocks (wip)


Company Price Div Yield Area
Elkem 23.8 2.6 10.9% Metals and alloys
Ocean Yield 56.6 6.12 10.8% Ship owner/charter
Selvaag Bolig 43.8 4.5 10.3% Real estate developer
Sparebanken Ost 54.4 4.6 8.5% Financial and real estate
Sandnes Sparebank 64 5.2 8.1% Financial and real estate
Sparebank 1 BV 37.1 2.95 8.0% Financial and real estate
Fjord1 35.5 2.7 7.6% Public transport
Europris 25.9 1.85 7.1% Discount variety retailer
Webstep 23.8 1.6 6.7% IT services provider
Sparebank 1 Ostfold A. 222 14.6 6.6% Financial and real estate
Salmar 356 23 6.5% Seafood
Sparebanken Sor 94 6 6.4% Financial and real estate
Sparebank 1 Nord-Norge 66.7 4 6.0% Financial and real estate
Sparebank 1 SMN 94.8 5.1 5.4% Financial and real estate
DNB 156 8.25 5.3% Financial
Sparebank 1 Ringerike H. 204 10.6 5.2% Financial and real estate
Fjordkraft 43 2.2 5.1% Utility
Mowi 204 10.4 5.1% Seafood
AF Gruppen 169 8.5 5.0% Construction
Sparebanken More 320 15.5 4.8% Financial and real estate
KID 41.6 2 4.8% Home textile retail
Equinor 173 8.25 4.8% Energy
B2Holding 9.57 0.45 4.7% Debt purchasing
Sparebanken Telemark 117 5.5 4.7% Financial and real estate
Telenor 188 8.4 4.5% Telecom
Bouvet 297 13 4.4% IT consultancy
Sparebank Vest 53.4 2.3 4.3% Financial and real estate
Sparebanken SR-Bank 105 4.5 4.3% Financial and real estate
Kitron 9.4 0.4 4.3% Electronic equipment
Gjensidige Forsikring 173 7.1 4.1% Insurance
Noksk Hydro 30.9 1.25 4.0% Aluminium producer
Austevoll 88.7 3.5 3.9% Seafood
Leröy Seafood 56.5 2 3.5% Seafood
Grieg Seafood 117 4 3.4% Seafood
Orkla 76.6 2.6 3.4% Investment firm
Entra 135 4.5 3.3% Gov real estate
Norway Royal Salmon 182 6 3.3% Seafood
Data Respons 31.1 1 3.2% Embedded solutions
Olav Thon 146 4.4 3.0% Real estate developer
Infront 18.4 0.45 2.4% Financial markets IT
Borregaard 94 2.25 2.4% Biorefineries
Sbanken 73.2 1.75 2.4% Financial and real estate
NTS 63 1.5 2.4% Transport
Kongsberg Gruppen 117 2.5 2.1% Maritime technology
AKVA 79.2 1.5 1.9% Fishery equipment
Pareto Bank 37.5 0.7 1.9% Financial and real estate
Bakkafrost 474 8.25 1.7% Seafood
Medistim 134 2.25 1.7% Medical devices
Tomra 291 4.5 1.5% Recycling

Friday, May 31, 2019

Measuring your assets

From this moment on, I will ignore the percentage gains and losses for all my holdings. I will only focus on two metrics:
  1. Yearly dividend change
  2. Number of shares held.
The rationale behind this is simple: there is no point in measuring the market valuation of the assets held. Caring about the market valuation is important if once wishes to speculate on price movements; I do not. 

Our main goal with investing is to create a steady and ever growing base of rent generating assets. As such, the yearly dividend change is the metric to focus on. It is therefore more interesting to post the number of shares held and their rent generating capacity than is the valuation of the asset.

The only thing that becomes a bit more difficult with only using dividend and number of shares held is the rebalancing of the portfolio. The solution to this is 
  1. While in cash position (as we are now with almost 50% of the holdings in cash), the investments are rebalanced by simply buying more of an undervalued stock/ETF.
  2. Once cash position is reduced to around KSEK 100, the yearly rebalancing will take place using a net present value of future dividend payments.

The net present value of future dividend payments will result in a focus on dividend growth stocks for now, and more stable dividend payers later. To avoid a situation where everything goes into stable dividend stocks and hampers future growth, the portfolio will also take into account the amount needed to live comfortably (around KSEK 30 a month, which, today, is about MSEK 12). 

Tuesday, May 28, 2019

Månadsrapport Maj 2019

Maj månads utdelningar


AKEL 250
AOS 21.08
BETS 601
BNS 36.76
BURE 96
HEMF 180
INDU 632.5
INVE 1350
KIND 276.3
LATO 1612
LIFCO 46
O 86.86
SAGA 180
SPHD 140.62
Totalt 5509.12

(XACT HDIV delar ut i maj (SEK 11 304 totalt), men jag räknar det i nästkommande period då jag bryter månaden den 25:e pga. lön. Räknar vi hela maj blev utdelningen totalt SEK 16 849).

Affärer

Plan var även att kolla Data Center REITs (fortfarande ej skett). Gjorde större inköp med fruns konto för att minska exponeringen i SEK.


AOS 15
BETS 165
HEMF 300
INDU 5
KIND 130
LATO 100
LUND 50
Sampo 30
XACT HDIV 1000
Fonder
S Globalfond Invest 143
Robur Access Asien 38

Utdelningen ökar därmed med dryga SEK 9300 om allt håller sig lika.

Resultat

20190425 - 20190524
Mina konton
Avanza KF 97.17
Nordnet KF 96.18 (länk)
Nordnet ISK 97.13 (länk)

Fruns konton
Avanza KF 97.28
Nordnet KF 97.99
Nordnet ISK 96.61

Plan nästa månad

Data center REITs fortfarande intressant. Fortsätta bygga en bevakningslista över olika aktier med fokus på real assets. Finns en del blue-chips som nu tagit stryk av USA KINA --> utvärdera och köp in. Mindre slant i Nordea då nedgången känns överdriven (sista inköpet, sen blir det Sampo). Utdelningarna från HDIV bör rulla in, dessa ska investeras tillbaka in i HDIV.

Sunday, April 28, 2019

Månadsrapport April 2019

Månadens utdelningar

Aktie
SEK
WM66.04
CNI22.25
BPY999.59
BIP415.11
BEP709.09
SPHD93.01
VGWL3.62
VFEM150.61
SAMPO446.36
CAST457.50
SEB325
SHB1100
LUND608
NDA4458.58
O83.77
Totalt
9938.53

Affärer

Plan var även att kolla Data Center REITs (ej skett). Vidare var det flytt förra månaden med ökade utgifter på KSEK 15 så det blev inte mycket över till aktier. Utdelningarna kom dock in fint och det blev lite Akelius. En lite trade i SWED genomfördes med 10.5% vinst och drygt SEK 400 i fickan. Jag gillar ju som bekant inte Swedbank då deras exponering mot svenska obundna bostadslån skrämmer mig. Sålde även observationsposten i Kinnevik i början av månaden och missade en 10%-ig uppgång där.

Affärerna blev:
20 AKEL PREF
30 SWED
(30) SWED
(10) KINV

Utdelningen ökar därmed med SEK 317.5 per år.

Resultat

MAR19
Avanza KF 106.06
Nordnet KF 103.53 (länk)
Nordnet ISK 105.66 (länk)


Plan nästa månad

Data center REITs fortfarande intressant. Ska bygga en bevakningslista över olika aktier. Frun och jag kommer slå ihop våra konton.

Monday, April 1, 2019

Månadsrapport mars 2019

Månadens utdelningar

Aktie
SEK
MMM40.4
SPHD92.31
O83.23
JNJ134.29
Totalt
350.23


Affärer

Planen var att köpa Emerging Markets, Bank, Sampo och XACTHDIV. Plan var även att kolla Data Center REITs (ej skett). Skogsbolag och IT infrastruktur var icke intressant efter en närmare analys.

Inköpen blev:
25 XACTHDIV
15 SAMPO. Initierar en position i bolaget
20 SHB A
12 LUND
115 NDA SE
80 IS3N - iShares MSCI EM (lik VFEM men inkluderar Sydkorea och har mer tech).
(40.3273) Länsförsäkringar global index. Byter till bank.
11.7536 Swedbank Robur Access Asien.

Utdelningen får en liten boost och exponeringen mot Sverige samt emerging markets ökar.

Resultat

FEB19
Avanza KF 100.6
Nordnet KF 99.85 (länk)
Nordnet ISK 101.15 (länk)


Plan nästa månad

Data center REITs fortfarande intressant. Inköp av en mindre post i Swedbank givet skandalerna och annat skit som kommer blåsa över. Dock sker flytt april 1 med extra utgifter på dryga KSEK 15, så det blir inte mycket över till aktier.

Tuesday, March 12, 2019

Three main types of assets to manage: Part 1 of 3

Today, I wanted to synthesize my thoughts on the main types of assets you have to manage throughout your life as an investor. Many of these thoughts can be found in Jan Bolmeson's interview with Paolo Sodini (Swedish transcript here). I strongly recommend that video because it highlights some of the main concepts discussed below.

Three main types of assets to manage: Part 1 of 3

There are three main types of assets you have to manage throughout your life: 1) your human capital, 2) liquid assets your personal balance sheet, and 3) the illiquid assets on your balance sheet. There are of course significant overlaps between each of these three. The separation between them is a pragmatic one and not a theoretical one. In this first part of this series, we focus on the human capital.

The two main points I want to communicate is that each of these assets has a net present value, and that the balance between them shifts throughout life as you use one type of asset to gain another. To succeed with investing, you need to understand these three types of assets from a holistic perspective and actively consider how they are balanced. Having that said, let us look closer at the first asset type: Human capital.

Human capital

Human capital is an asset that contains first order skills such as what you know, who you know and who knows you, and second order skills such as how quickly you can learn and how good your social skills are. Here, we are only interested in the human capital that has a market value (which is far from the only value that matters in life).

The market value of your human capital: The time dimension

The market value of your human capital is directly tied to your ability to generate rent, i.e., an income. You can exchange your time on the market for money, and the more skilled you are the more money you can ask for your time (alternatively the less time you need to spend to collect a paycheck). Note, however, that some jobs have set time requirements that are hard to avoid. Anything that involves physical limitations usually fall under this category (you can only type at a certain speed, a pie needs to stay in the oven for a certain time, etc.). Here you have two options:
  1. you can parallelize work (i.e., do something else while the pie is baking), or 
  2. you can find ways to leverage the same work in multiple ways
Doing things in parallel is rather self explanatory and I believe most are familiar with this concept. Leveraging work, however, is something most people are rather poor at. The main idea behind work leveraging is to find a common set of time consuming tasks that support the widest set of additional value generating tasks possible, while ensuring that these additional tasks do not conflict with each other. 

Let's use a simple example: Adam works as a stock analyst for a large investment bank. On his spare time, he also runs a tiny bakery. Now, unless Adam analyzes bakeries, there is little potential to leverage the time spent at work to generate value at the bakery. Had Adam instead offered an online course in stock analysis, using cases from his work to illustrate key insights, he has successfully leveraged the time it took to conduct the stock analysis at work in two ways: a) to get a salary, and b) to get recurring income from his online course. Note that b) takes a small amount of additional effort, but they key here is that it leverages time already spent elsewhere.

To maximize the market value of your time, you need to do both parallel work as well as leverage work to its maximum potential. Want to take a break from writing an article? Then do some other menial task (admin?) you have to do anyway while your relax. Mentally fatigued right after lunch? Perfect time to train. Key point here is to find ways to create overlapping work tasks that require different types of intellectual effort. Relatedly, leveraging work hours is crucial (and probably far more impactful). At the present, I am leveraging multiple work hours in many ways. Here are a few examples:
  • Supervise BSc students focused on blockchains. Use these students to access companies (landed some major projects this way for very little effort). The supervision is super easy because it is a topic I know very well and actively work with.
  • Supervise PhD students. You learn tons here in exchange for the limited support you can give (sadly). Their insights can be used to further your own understanding in a very cost efficient way.
  • Apply for research projects based on the knowledge you gain from supervisions and your own research.
  • Offer consultancy to companies interested in the technology you are researching. Here you leverage both existing projects, and your own research as well as the research of those you supervise.
  • Do workshops and events. This leads to contacts that you can either later consult for or include as project partners.
  • Join various standard bodies as a technical advisor to set standards. You know what companies struggle with since you consult and have projects, and you know the tech.
  • ...
It seems like a very large list of things to do. But in reality, it is not. About 80% of the work is shared between all the different points. The rest of the 20% effectively doubles your hourly income.


The market value of your human capital: The skill dimension and the social dimension

There are less than 10 people in Sweden that truly understand blockchains from both a technical perspective as well as from an economic/business perspective. Every company wants advice on how to position themselves. It takes any company about half a year of full time work to arrive at the same conclusions you can give them in an hour. Your hourly rate will reflect this.

However, unless you have the right connections and contacts, you will never get the chance to stand to exchange your skill for that high hourly pay. Invest in both your social network and in your skills. Luckily, these go hand in hand. The more skilled you are the more invites you get etc.

The net present value of your human capital

Here is the core insight: your human capital has a net present value. In other words, the sum of all income you can and will produce with your skills has a present value that you can calculate by discounting all future income generated by your skills.

Now, the discount rate depends on your human capital of course. In other words, how likely is it that your skills can generate a stable income sustained over time? Another important consideration is the rate at which you can increase this income. Are you likely to gain salary increases? Or can you, at will, generate extra income in chunks? These questions are really hard to answer ...

Let us look at some statistics to illustrate the net present value of human capital. The table below is from SCB and only include income from human capital (i.e., capital gains from equities are not included). All numbers in SEK unless otherwise stated.

Median earned salary in kSEK chart ...

The net present value requires a discount rate. This is of course tricky to estimate, some basic rates are presented in the table below:

Rate
NPV_M
NPV_F
0%
15 621 300
12 786 200
1%
12 264 155
10 001 304
2%
9 786 207
7 951 780
3%
7 932 254
6 423 180
4%
6 526 257
5 267 759
5%
5 445 573
4 382 722
7%
3 939 879
3 155 870
10%
2 630 008
2 097 589
-1.78%
25 043 305
20 632 157

D = Discount rate
NPV = Net Present Value
_M = Male
_F = Female

That last number, -1.78%,  seems oddly specific ... but things will become clear once we account for real wage growth (i.e., inflation adjusted wage growth). Sadly, we do not know the "real" inflation numbers (which we need for the real wage growth) and there are many ways to calculate this, but here is one from ekonomifakta:


Based on that chart, we have a 1.78% real wage growth rate.

For the sake of simplicity, let's assume a 0% discount rate. With that rate, the average person will earn around 13.5 MSEK. Funny enough, this number is very close to SACO's estimations listed here.

Using the SACO graph linked above, we can see that those who are in high earning positions (doctors, lawyers, economists, and engineers) earn about 16-18 MSEK by the time they retire. Now, if you are a a bit savvy and entrepreneurial, you can add a lot to this income (especially if you are an engineer).

Jan Bolmeson put it best when he said that "I am a walking bond". How much is this bond worth? Hard to tell, but a range of 8-30 MSEK based on ones willingness to acquire human capital and ones ability to charge for it probably covers most cases.

Conclusion

You can treat your own pre-retirement human capital as a bond with a net present value of between MSEK 8-30.

In the next article of this series, we will look closer at the two other type of assets you will acquire throughout your life, i.e., liquid assets (equities, bonds, cash, etc.) and illiquid assets (gold, house, paintings etc.).

Monday, February 25, 2019

Månadsrapport FEB19

Från och med nu sker månadsrapporten med startdag den 25:e varje månad.

Månadens utdelningar

Aktie
SEK
AOS20.33
SPHD85.43
O177.65
Totalt
283.41
Inte mycket att hänga i julgranen.

Affärer

Planen var att köpa Emerging Markets, Bank, och XACTHDIV. Inköpen blev:
125 XACTHDIV
30 AKEL PREF. Ny position. Utd.
12 LUND B
(6) SKA B. Inväntar krash. Observation.
(20) BONAV B. Växlar över till bank.
38 SEB A. Från observation till Utd.
110 SHB A. Från observation till Utd.
475 NDA SE. Från observation till Utd.
(KSEK 19.5) Länsförsäkringar Global Index
(30) LIFCO B - Högt värderad och låser in lite vinst efter en 142%-ig avkastning.
66 IS3N - iShares MSCI EM (lik VFEM men inkluderar Sydkorea och har mer tech).
80 QDVE - iShares S&P IT Sector
40 QDVG - iShares Health Care Sector
(3) MMM - Minskar den cykliska risken. Bevakningslista.
(45) O - Minskar en del och tar hem en 132%-ig avkastning. Hög värdering motiverar brott från "öka vid dipp".

Med det borde årliga utdelningen öka med dryga SEK 4440. Exponering mot Sverige ökar lite via bankerna. Håller mig helt borta från Swedbank. Flyttar bort pengar från kontot med då jag tror de kommer köra en bail-in ifall bostadsnedgången tar fart.

Resultat

FEB19 uppgång [%]
Avanza KF +8.56
Nordnet KF +9.02 (länk)
Nordnet ISK +5.07 (länk)


Plan MAR19

Planerade inköp till nästa månad är mer emerging markets. Sampo (möjligen efter analys). Bank? I annat fall, XACTHDIV. Data center REITs fortfarande intressant. Kolla mer på IT infrastrukturbolag. Ska även kolla en del på skogsbolag i Norden för att skydda mot kronfallet.

Tuesday, February 5, 2019

Davos 2019, vänsteridioti, och skatter som svaret på allt

Panelen fick lite grillning av Rutger Bregman och några andra (se https://www.youtube.com/watch?v=r5LtFnmPruU)

Det sades en massa där som låter riktigt hjärtligt och välmenande men som vid en närmare granskning inte framstår som helt så enkelt. Nedan tar jag upp vissa av dessa punkter:

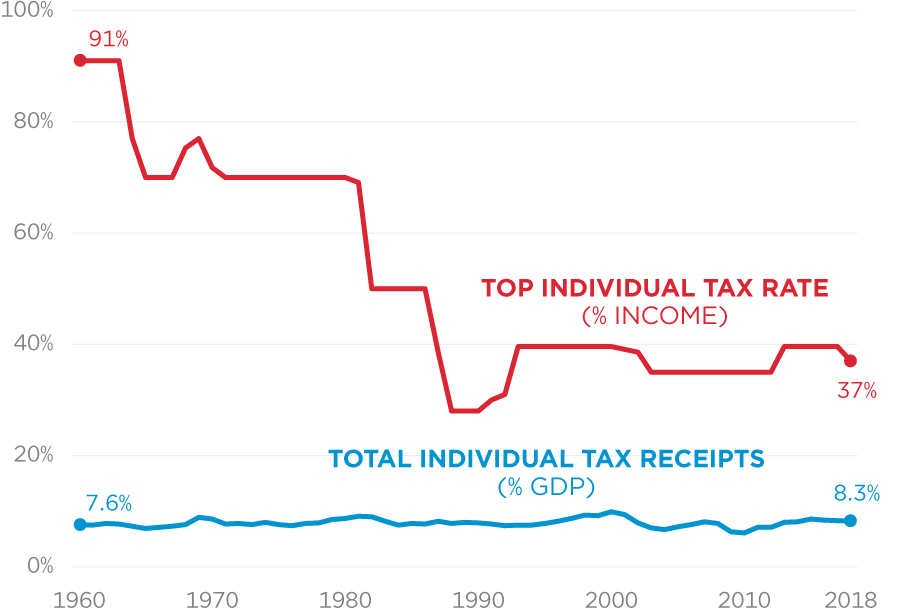
1. Angående frågan om var en hög marginalskatt faktiskt har bidragit med tillväxt besvarade Bregman med att påtala att USA haft hög marginalskatt (läs 70+%) under en period med enorm tillväxt. Detta är ett ganska vinklat påstående. Det spelar mindre roll vad marginalskatten var och större roll hur mycket skatt folk betalar. Jag rekommenderar denna artikel för detaljerna, men i korthet kan man sammanfatta argumentet mot detta påstående som att [marginal tax rate] != [tax income]. Läs även Hauser och Laffer för mer om hur skatter och beteenden påverkar varandra.


2. Winnie fliker sedan in med påståendet om att de rika blivit rikare och de fattiga fattigare. Källan till hennes uttalande är en rapport gjord av Oxfam. Metoden till studien hittar vi här. De rikas tillgångar uppskattas enligt Forbes. Perioden är mellan mars 2008 och mars 2018. Allt mätt i USD. Redan här har vi ett stort problem. De rika äger majoriteten av alla värdepapper. Om du väljer att bedöma jämlikhet utifrån den parameter som mest gynnar de rika (dvs värdepapper) under en period som varit helt genomsnittlig för tillgångslaget (2008-2018) så är det väl inte helt orimligt att de som äger mest av detta tillgångsslag ökar sina rikedomar i snitt med vad tillgångsslaget levererar. Inte helt oväntat så visar Oxfam rapporten att antalet billionaires dubblats sedan mars 2008. De hade inte behövt använda en så krånglig metod som de gjorde ... de kunde ha använt en investment calculator och fått liknande svar. Seriöst ... gå till portfolio visualizer och skapa en 40/60 portfölj med TLT och SPY. Utvecklingen på en sådan portfölj illustreras nedan.

Den grafen korrelerar med billionaires ... mao mäter Oxfam helt enkelt asset movements som FED skapat via QE och räntetrycket.

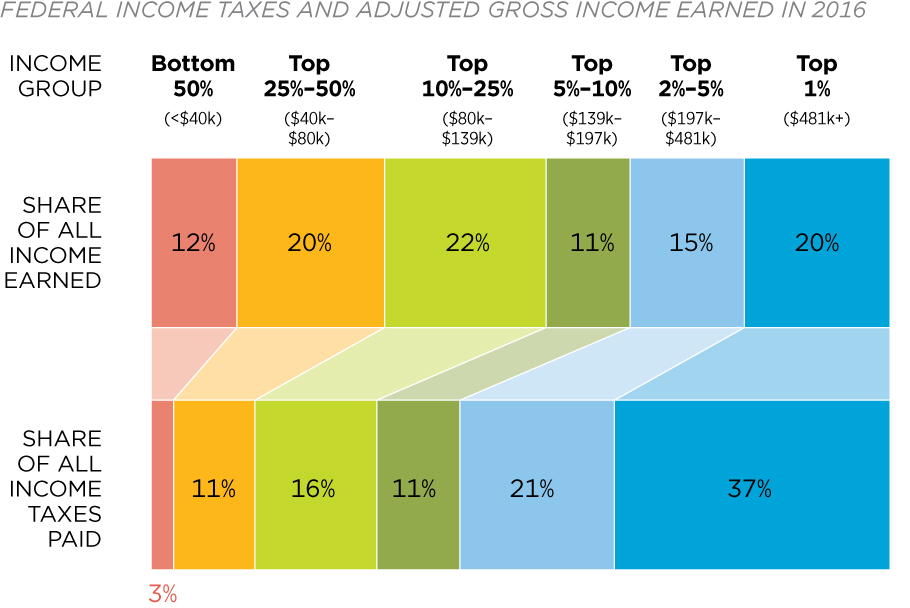
Oxfam föreslår sedan en rad åtgärder, inklusive en skatt på tillgångar. Detta rättfärdigas med påståendet att enbart 4% av skatter kommer från "wealth". Visst. Men de rikaste står redan för majoriteten av alla skatter i många länder! I USA får top 1% 20% av alla inkomster men betalar 37% av alla skatter.


Oxfam gör en massa missvisande påståenden som att de rikaste 10% betalar mindre i skatt än de fattigaste 10% på "income". Räknar man in kapitalintäkter i detta så är ju detta helt sant då kapitalvinstskatt beskattas med flat rate i många länder, vilket gör att man t.ex. i Sverige faktiskt betalar mindre i skatt på inkomst om man äger mycket utdelande aktier. Igen, då de rika äger mest av aktierna och andra värdepapper så gynnas de mest av ISK/KF.

Vi kommer sedan till påståendet om att de fattiga blivit fattigare. En sak att klargöra först är att de rika inte blivit rikare på bekostnad av de fattigare! Detta är oerhört viktigt. Varför har de fattiga blivit fattigare då? Oxfam svarar inte på detta. Deras källor för data från fattiga länder är bristande och de gör inga bra redogörelser. En tydlig orsak finner vi dock i att jämförelsen görs i USD och inte i lokal valuta som annars borde anses mer logiskt. Igen, detta handlar helt om makroekonomiska rörelser, i detta fall valutor. Tittar vi på MSCI Frontier Markets Africa så ser vi exakt samma slutsatser som Oxfam vinklar som orättvisa.


Notera att den där grafen inte ens är inflationsjusterad. Vad är då anledningen till fattigdomen som nu växer i USD? Svaret är skitenkelt: ett starkare USD!

Oxfam rapporten innehåller för övrigt en massa annat fullständigt galet och idiotiskt som att obetalt arbete från kvinnor runt om i världen motsvarar ett bolag som är 43ggr så stort som Apple. Problemet är att mycket arbete inte kan kopplas till en marknad och till en prismekanism. Det är föga troligt att superrika investerare i hela världen skiter i en potential som är 43ggr Apples storlek ... nåja. Låt oss fortsätta.

3. Winnie kritiserar sedan att bolag maximerar vinster för sina aktieägare och att de lurar alla stackars fattiga. För det första är företag enligt lag skyldiga att maximera nyttan för sina aktieägare. För det andra så blir ju bolag rika (och deras aktieägare likaså) ENBART genom att de producerar grejer som konsumenter köper och vill ha! Dell, Apple, Microsoft, etc. har ju sålt produkter till konsumenter och ingalunda lurat till sig deras pengar. Om det hela är så orättvist ... varför organiserar då inte de "utnyttjade" sig och startar egna bolag som inte lurar dem på deras pengar? Enkelt: för att Winnie inte har en aning om vad hon pratar om.

4. Winnie drämmer sedan till med ett helt urkorkat påstående som gör att jag börjar vifta med armarna. Denna person menar på fullaste allvar att skatteflykt från rika länder är fel då dessa pengar kan användas för att bidra till fattiga länders utveckling.

Diskussionsledaren gör ju givetvis absolut inget för att peka ut dessa idiotiska påståenden. Hur som ...

5. Sen kommer ett gäng med floskler där en person brukat en random sentence generator med följande input set {circular economy, sustainability, inequality, solar, intergenerational, future, climate change, ecosystem}. Hon har inte en blekaste aning om vad hon pratar om. Än värre, hon är respektlös mot de som jobbar stenhårt med att lösa dessa problem på daglig basis genom att underminera deras insatser. Det är inte så att vi inte vill använda solen som energikälla eller att vi aldrig tänkt på det ... det är bara riktigt jädrans svårt att få DER system att fungera.

Jag slutar lyssna nu då Bregman igen drar till med ngt idiotiskt...

Det är oroande att vänstervågor sveper över USA och västvärlden. Världens problem kommer inte lösas med symbolpolitik och vänsteridioter som inte har någon aning om hur världen fungerar.

PS <3 Jane Goodall :).

Wednesday, January 30, 2019

Update januari

Januari månads utdelningar är som följer:

Aktie
SEK
SPHD 78
VFEM 197
VGWL 3
O 143
BPY 560
BEP 426
BIP 231
Totalt 1638

För januari 2018 så var motsvarande 138 SEK. Ett klart lyft! Det är ofta inte enkelt att finna motivationen när utdelningarna är supersmå. Ett sätt är att hitta en utgift som utdelningarna täcker. Denna månads utdelningarna täcker mitt månadskort för att pendla till jobbet och tillbaka i februari!

Resultatet för månaden
Avanza KF +9.2 (här har Brookfield presterat bra, INDU och JNJ drar ner)
Nordnet KF +6.48
Nordnet ISK +5.16 (här har Latour och Castellum agerat ankare och dragit ner resultatet)

Planerade inköp till nästa månad är MSCI Emerging Markets fonden på Nordnet, XACT Högutdelande, Nordea och SEB.

Data center REITs har kommit ner en bit men jag avvaktar och ser då jag inte gjort ngn större analys att basera ett inköp på.

Sunday, January 27, 2019

Arne Talving (Kavastu) om blockkedjor

Jag kan inte ett skit om aktier och investeringar. Därför försöker jag lära mig så mycket jag bara kan från andra bloggare. Idag blev jag dock påmind om att dubbelkolla allt som sägs och skrivs även från de mest populära bloggarna! Arne skriver ett inlägg om Bitcoin och andra kryptovalutor här: http://arnetalving.se/2019/01/21/sa-kan-du-bli-rik-pa-bitcoin-blogg/

Jag kan som sagt inte mycket om aktier. Bitcoin och blockkedjor kan jag dessto mer om :). Arne har rätt i sin skepsis, men av helt fel anledningar. Jag skrev en kommentar till hans blogginlägg men vet inte om den kommer publiceras så jag listar mina huvudsakliga motargument "verbatim" här:

  1. Argumentet att saker inte har värde för att vi inte använder dem IDAG är bristande (olja hade inget värde innan Nobel). Den tekniska lösningen på koordinationsproblemet som Nakamo löste är helt unikt och banbrytande. Värdelogiken är ännu okänd. Dock innebär detta ej den aldrig kommer finnas.
  2. Energiåtgången för den tekniska potential som blockkedjor erbjuder är försummbar om du jämför med vad den kan komma att ersätta. Det är inte ovanligt att nya tekniker är ineffektiva inledningsvis. Dessutom är det inte mängden energi, utan källan som vi bör fokusera på.
  3. Ingen garant och central koordinator är hela poängen.
  4. Varianter av ny teknologi innan "dominant design" inträder är vanligt.
  5. Lägg ner den där struntboken Arne :). Kolla detta istället https://www.coursera.org/learn/cryptocurrency
  6. Warren Buffetts ord om hur teknologi kan stötta distribuerad koordinering av ett datatillstånd är värt 0. Det är för tidigt att uttala sig om en värdelogik.
  7. Onecoin är mer lik den svenska kronan än vad den är Bitcoin (Onecoin har INGET med blockkedjor att göra).
Det är oerhört viktigt att hela tiden granska det andra säger. Jag har en oerhörd respekt för Arnes kunskaper inom aktier, men skulle inte lägga mycket vikt i det han säger utanför hans kompetensområden. Det har inget alls med Arne att göra, jag gillar verkligen det han gör och stöttar honom fullt. Att inte lägga vikt i saker som sägs när någon inte har erfarenheten och kunskapen är mer en yrkesskada från doktorandtiden :). Arne är absolut inte ensam om detta, jag vet att Jan Bolmeson på www.rikatillsammans.se även han hade en artikel om blockkedjor och Bitcoin. Den innehöll en rad felaktigheter den med. Samma sak här dock, jag tycker Jan är en av de viktigaste utbildarna vi har i Sverige idag. Dock ska man ALLTID vara kritisk. Ställ dig ALLTID frågan ifall folk har kunskaper nog att kunna uttala sig om en viss sak. De kan i all sin välvilja ställa till det. Just idag och i fallet Bitcoin har nog både Arne och Jan rätt, men av fel anledningar :).

Thursday, January 17, 2019

Svenska banker vid en svensk bostadskrash

Money growth has a significant effect on house prices and credit, credit influences money and house prices, and house prices influence both credit and money. This link is found to be stronger over a more recent sub-sample from 1985 to 2006 [...] Shocks to GDP, the CPI, and the interest rate are in turn found to have significant effects on house prices, money, and credit. The empirical analysis further reveals that the effects of shocks to money and credit on house prices are stronger when house prices are booming than otherwise. - Goodhart & Hofmann 2008

Ett par grundantaganden i denna artikel:
  • Bostadspriser på LÅNG sikt drivs primärt av fundamentala faktorer.
  • På KORT sikt styrs priserna mest av bolånemarknadens karaktär.
  • Huspriserna har en multidirectional link till ekonomisk expansion, krediter, och hushållens skulder.
  • Genom att studera bankernas exponering mot den svenska husmarknaden kan man bedöma risken som banker exponerar sig för givet en priskorrektion på bostäder i Sverige.

Boverkets rapport pekar ut ett par faktorer som karaktäriserar marknader som ligger risigt till:
  1. Rörliga räntor
  2. Kunder tar ut kapital ur bostaden
  3. Höga belåningsgrader (80-90%)
  4. Marknadsvärdet/köpeskillingen påverkar beviljandet av bostadslån.

Sverige ligger möjligen risigt till :). Finansinspektionen visar på en del oroväckande data:
  1. Väldigt hög belåningsgrad bland de under 50. FIs rapport fångar inte heller in alla blancolån så det finns fog att misstänka att belåningsgraden är högre än 90% för <30 år och runt 80% för kategorin 31-50 år.
  2. Under 2017 hade 73% en ränta på upp till 1 år och den genomsnittliga räntebindningstiden var 1 år.
  3. Svenskarna räknar med en väldigt liten risk, 1-2% påverkan, för ränteuppgång (Diagram 6).
  4. En ränteuppgång med 5 procentenheter skulle innebära att 6% av hushållen får underskott (5.5% av total lånevolym). Med uppehåll i amorteringen är det 3.2%.
  5. Vid en arbetslöshet på 10% blir det drygt 4.2% som hamnar i underskott.
Normalt är rörlig ränta inte ett problem då högre räntor brukar förknippas med goda ekonomiska tider och hög sysselsättning. Samma argument gäller för t.ex. REITs i USA där många oroar sig för en ränteuppgång i onödan då denna uppgång ofta signalerar god ekonomi med tillhörande förmåga att höja hyror. Men om rörlig ränta brukar agera som en motvikt mot ekonomiskt aktivitet överlag är det aningen oroväckande att vi har negativa räntor i Sverige under en period av rekordhög sysselsättning.

Nåväl. Låt oss nu kolla på de olika bankernas exponeringar mot bolån. Det som är intressant är CRB-B, CRB-D,

Svenska bankerna

Nordea 2017 [EURm]

  • CRB-B siffrorna visar att exponeringen mot Retail på 184 871 (S 147 825).
  • Totala lån 470 129. 
  • CRB-C visar att 183 064 av totala Retail (S 146 552) var från Norden, varav 54 760 (S 48 676) var från SWE.
  • SWE totala lån 112 997
  • Företagslån var på 167 278.
  • CRB-D visar att 181 346 är public loans till retail.
  • CRB-E visar att 145 996 av 162 569 retail lånen var på över 5 år i maturity. 3 007 var rörliga. 9 156 var mellan 1-5 år. Resten on demand.

 Handelsbanken 2017 [SEKm]

  • CRB-B siffrorna visar att exponeringen mot Retail 1 031 681 (S 932 265)
  • Totala lån 2 686 311
  • CRB-C visar att 822 353 av total Retail var från SWE.
  • Sverige totala lån 1 565 762 
  • Totala företag 1 325 060
  • Hittar inte public men "other" listar 911 416 till retail (samt ett betydande lån på 684 506 till "corporates real estate activities").
  • CRB-E visar att 532 732 är rörliga lån. 228 749 är mellan 1 till 5 år. 172 380 är 5+ år. Resten on demand.

SEB 2017 [SEKm]

  • CRB-B siffrorna visar att exponeringen mot Retail 620 230 (S 538 330)
  • Totala lån 2 267 199
  • CRB-C visar att 529 897 (S 481 032) av total Retail var från SWE.
  • Sverige totala lån 1 138 924
  • Totala företag 1 193 343
  • CRB-D visar att 544 380 retail (S 477 430) är household. 
  • CRB-E visar att 67 275 är rörliga lån. 204 399 är mellan 1 till 5 år. 318 882 är 5+ år. Resten on demand.

Swedbank 2017 [SEKm]

  • CRB-B siffrorna visar att exponeringen mot Retail 1 144 188 (S 1 003 783)
  • Totala lån 2 113 147
  • CRB-C visar att 1 054 564 av total Retail var från SWE.
  • Sverige totala lån 1 603 083
  • Totala företag 597 175
  • CRB-D visar att 866 167 av retail är mortgage. 
  • CRB-E visar att 700 134 är rörliga lån. 277 690 är mellan 1 till 5 år. 87 381 är 5+ år. Resten on demand.

Sammanfattning

Tabellen nedan visar på jämförande nyckeldata.

[MSEK] Nordea Handelsbanken SEB Swedbank
Retail exposure
1,898,625
1,031,681
620,230
1,144,188
- of which secured
1,518,163
932,265
538,330
1,003,783
- public retail
1,862,423
911,416
544,380
866,167
Total loans
4,828,225
2,868,311
2,267,199
2,113,147
- of which from SWE
1,160,479
1,565,762
1,138,924
1,603,083
SWE retail exposure
562,385
822,353
529,897
1,054,564
- of which public
499,903
N/A
481,032
N/A
Total corporate loan
1,717,945
1,325,060
1,193,343
597,175
5 year retail maturity
1,499,379
172,380
318,882
87,381
1-5 year retail maturity
94,032
228,749
204,399
277,690
<1 year retail maturity
30,882
532,732
67,275
700,134
Retail exposure
39.32%
35.97%
27.36%
54.15%
SWE retail exposure
11.65%
28.67%
23.37%
49.90%
SWE exposure
24.04%
54.59%
50.23%
75.86%
Short term loans
1.63%
51.64%
10.85%
61.19%
Long term loans
78.97%
16.71%
51.41%
7.64%
Public retail exposure
98.09%
88.34%
87.77%
75.70%
Secured retail
79.96%
90.36%
86.80%
87.73%

Banken med högst exponering mot Sverige och dess bostadsmarknad är Swedbank. Obundna lån på 61% samt en exponering mot retail på 54%. Tryggast verkar Nordea vara med en låg retail exposure, framför allt mot Sverige, samt en hög andel bundna lån. Även SEB verkar ok. Handelsbanken ser ok ut, men har lite för hög andel obundet.

Lustigt nog verkar ingen bank ha en 73%-ig exponering mot 1-åriga lån som FI visar ovan. Möjligt att folk har både bundet och icke bundet samtidigt.

Nu har ju givetvis dessa banker andra risker att ta hänsyn till. Men som en hedge mot Svenska bostadsmarknaden är det nog absolut tryggast att spara i Nordea. SEB och SHB är ganska likvärdiga. Dock ska man nog hålla sig borta från Swedbank om man är rädd för en svensk bostadskrash. Dvs .. gå kort Swedbank om du vill ha en bostadshedge.

Jag har redan öppnat en liten smygposition i Nordea och i SHB. Kommer utöka min analys i senare artiklar för att välja en bank. I denna första runda kan jag dock välja bort Swedbank.